Significance
Importance To Berry Global and our Stakeholders
Responsible water management is essential to minimizing our environmental footprint and ensuring operational continuity, particularly in water-stressed regions. As freshwater availability decreases and global temperatures rise, our commitment to water stewardship becomes increasingly critical. Though our operations primarily use water for cooling purposes, we recognize our responsibility to protect this finite resource through innovative conservation approaches.
Customer Partnerships: Water forms the lifeblood of our customers' operations—whether nurturing the crops essential for food production or serving as a key ingredient in their products. Our customers rightfully expect exemplary water stewardship that aligns with their own sustainability commitments and secures their long-term resource needs.
Investor Protection: Our comprehensive water management strategy delivers dual financial benefits by reducing operational costs and mitigating water-related risks. By implementing forward-thinking water conservation practices, we protect against potential operational disruptions while demonstrating responsible resource management—enhancing long-term business resilience.
Our Approach
At Berry, we are dedicated to mitigating the local water-related impacts of our facilities through continuous improvement and, when appropriate, close coordination with local authorities. Our approach involves systematic monitoring and reporting of water withdrawals and consumption, enabling us to identify and implement targeted projects that reduce water withdrawal intensity. We prioritize water-related initiatives and site-specific projects in high water risk areas and facilities with above-average water usage. Water risk is determined utilizing the World Resources Institute (WRI) Aqueduct Water Risk Atlas to conduct annual water risk identification and mitigation. Our strategy includes requiring site-level action plans from high-risk facilities that focus on implementing best-practice water efficiency improvements and engaging with local communities on water-related challenges. Additionally, we have implemented Operation Clean Sweep across our operations to prevent pellet pollution in local water sources, and we maintain comprehensive tracking of total water withdrawals, consumption, and discharge across our business.
Highlights and Target Progress
| Priority | 2024 Update |
| Reduce Water Consumption Intensity 1% per year* |
Water withdrawal intensity increased by 1.4% due to reduced production rates. We continue to develop site-level action plans at high-risk facilities to mitigate our water risk. |
*Normalized for production (M³ of water withdrawn per MT of production)
Key Metrics
The below metrics are based on Berry's Fiscal Years unless otherwise noted.
|
Water and Wastewater Management |
||||||
| 2022 | 2023 | 2024 | ||||
| Absolute Water Withdrawals | Amount and Percentage of Total Withdrawals | |||||
| M3 | Percentage | M3 | Percentage | M3 | Percentage | |
| Total Withdrawals | 7,521,862 | 100% | 7,537,951 | 100% | 7,426,003 | 100% |
| Surface Water | - | 0% | - | 0% | - | 0% |
| Ground Water | 1,149,171 | 15% | 671,153 | 9% | 741,956 | 10% |
| Municipal Water | 6,372,691 | 85% | 6,866,798 | 91% | 6,684,047 | 90% |
| Withdrawals from areas with Water Stress¹ and Percentage of Total Withdrawals | ||||||
| M3 | Percentage | M3 | Percentage | M3 | Percentage | |
| Total Withdrawals | 1,575,088/td> | 21% | 1,810,170 | 24% | 1,802,639 | 24% |
| Surface Water | - | 0% | - | 0% | - | 0% |
| Ground Water | 361,652 | 5% | 383,4332 | 5% | 409.547 | 6% |
| Municipal Water | 1,213,436 | 15% | 1,426,738 | 19% | 1,393,092 | 19% |
| Water Withdrawal Intensity | Withdrawals per MT of Production (M³/MT) | |||||
| All Withdrawals | 1.97 | 2.11 | 2.11 | |||
| Surface Water | - | - | - | |||
| Ground Water | 0.29 | 0.30 | 0.21 | |||
| Municipal Water | 1.68 | 1.81 | 1.9 | |||
| Withdrawals per MT of Production from areas with Water Stress¹ (M³/MT) | ||||||
| Total Withdrawals | 2.51 | 1.89 | 1.86 | |||
| Surface Water | - | - | - | |||
| Ground Water | 0.45 | 0.40 | 0.42 | |||
| Municipal Water | 1.93 | 1.49 | 1.44 | |||
| Absolute Water Consumption² | Amount and Percentage of Total Water Consumption | |||||
| M3 | Percentage | M3 | Percentage | M3 | Percentage | |
| Total Consumption | 2,350,359 | 100% | 1,232,823 | 100% | 1,083,369 | 100% |
| Consumption in areas with Water Stress¹ | 408,677 | 17% | 305,146 | 25% | 378,668 | 35% |
| Absolute Water Discharge² | Amount and Percentage of Total Discharge | |||||
| M3 | Percentage | M3 | Percentage | M3 | Percentage | |
| Total Discharge | 6,027,934 | 100% | 6,305,128 | 100% | 6,342,634 | 100% |
| Surface Water | 842,348 | 14% | 2,470 | 0% | 8,461 | 0% |
| Ground Water | 569,846 | 9% | 89,459 | 1% | 482,530 | 8% |
| Third Party (Sewer/Treatment) | 4,615,740 | 77% | 6,213,199 | 99% | 5,851,643 | 92% |
| Discharge in areas with Water Stress¹ and Percentage of Total Discharge | ||||||
| M3 | Percentage | M3 | Percentage | M3 | Percentage | |
| Total Discharge | 1,166,412 | 19% | 1,505,023 | 24% | 1,423,971 | 22% |
| Surface Water | 4,019 | <1% | 0 | 0% | 0 | 0% |
| Ground Water | 370,331 | 6% | 355,128 | 6% | 360,443 | 6% |
| Third Party (Sewer/Treatment) | 792,062 | 13% | 1,149,895 | 18% | 1,063,528 | 17% |
| Water Risk | Number and Percentage of Facilities | |||||
| Number | Percentage | Number | Percentage | Number | Percentage | |
| Facilities identified as High-Risk³ | 47 | 18% | 66 | 28% | 69 | 30% |
| Facilities identified as Highest-Risk⁴ | 15 | 6% | 22 | 9% | 24 | 10% |
| Facilities identified in areas with Water Stress¹ | 42 | 16% | 62 | 26% | 58 | 25% |
| Facilities identified in areas with Water Stress¹ by 2030⁵ | 85 | 32% | 81 | 35% | 77 | 33% |
| Facilities identified in areas with Water Stress¹ by 2040⁵ | 86 | 32% | No Data | n/a | No Data | n/a |
| Facilities identified in areas with Water Stress¹ by 2050⁵ | No Data | n/a | 94 | 40% | 90 | 39% |
| Facilities identified in areas with Water Stress¹ by 2080⁵ |
No Data | n/a | 101 | 43% | 97 | 42% |
2 A high-risk facility is one that is located in an area considered high, or extremely high risk in any water risk category using the WRI Aqueduct tool.
3 Highest-risk facilities are facilities that have been identified as High Risk (see above) and their absolute water withdrawals or water withdrawal intensity are above the Berry Global average.
4 Areas defined as having a high risk or greater of baseline water stress by 2030, 2040, 2050, and 2080 using the WRI Aqueduct tool.
Key Strategies

Our resources are strategically concentrated on facilities in high-water risk regions and locations with above-average consumption patterns. However, we recognize that water conservation opportunities exist throughout our operations and encourage all facilities to implement continuous improvement initiatives regardless of their baseline water profile.
Beyond consumption management, we've implemented Operation Clean Sweep® across our entire operational footprint—a proactive program designed to prevent plastic pellet, flake, and powder loss to the environment, protecting local waterways from potential contamination.
Analyzing Water Risk

Our comprehensive approach includes a rigorous annual water risk identification and mitigation process that runs parallel to our enterprise risk assessment. We leverage the World Resources Institute (WRI) Aqueduct Tool—an advanced, peer-reviewed global water risk mapping platform—to identify basin-specific risks across our operational footprint.
This sophisticated tool evaluates multiple risk dimensions:
- Baseline water stress conditions
- Water quantity vulnerabilities (scarcity, drought, flooding)
- Water quality challenges
- Regulatory complexity
- Reputational considerations
Beyond current conditions, we utilize the platform's predictive modeling capabilities to identify locations potentially facing baseline water stress in 2030 and 200 under various climate scenarios, enabling proactive long-term planning and strategic infrastructure investments.
For facilities operating in regions classified by WRI as high or extremely high risk across major risk categories, we implement a response system that includes:
- Direct notification to facility management and divisional leadership
- Development of site-specific water risk mitigation plans
- Implementation of industry-leading water efficiency practices
- Strategic community engagement on watershed-level challenges
We further refine our approach by cross-referencing high-risk locations with operational water intensity metrics. Facilities with both high geographic risk and above-average water intensity receive our "highest risk" designation, triggering enhanced processes:
- Specialized action plans developed in partnership with our corporate water expertise team
- Comprehensive water requirement assessments
- Identification of targeted efficiency opportunities
- Potential implementation of facility-specific water reduction targets
Our 2024 assessment identified 30% of our facilities in high-risk regions, with 10% (24 facilities) meeting our highest risk criteria. Additionally, 25% of our operations currently face baseline water stress—projected to increase to 33% by 2030 under business-as-usual scenarios.
We maintain transparency through annual reporting on our water governance and risk management processes via the CDP platform, providing stakeholders with detailed insights upon request. Our latest disclosure can be found here.
Managing and Measuring Water Metrics
To fully assess the Impact of our water usage, we track the total water withdrawn, consumed, and discharged across the business. Water withdrawals reflect our total water usage, but only a small portion of this water is consumed through processes, mostly through evaporation. The majority of the water is withdrawn as processed water and discharged in the same condition from which it was withdrawn. However, several facilities draw from groundwater and surface water stores to supplement their water requirements.
Water Withdrawals

Water Consumption and Discharge
Compared to the amount of water we withdraw, we consume only a small amount, with most consumption resulting from evaporative losses. While our focus is on reducing overall withdrawal requirements, we continue to explore projects to create closed-loop processes where possible to reduce water consumption. A total of 35% of water consumption occurs in areas with baseline water stress.
Water is usually discharged from our operations through municipal systems, such as third-party sewage treatment, with a small portion discharged as surface water back into the environment. Before discharge, we monitor and treat wastewater to ensure the appropriate quality for release, in line with all regional or local regulations, with individual parameters set for each facility. As such, we do not report wastewater discharge quality annually at a group-wide level. Data relating to wastewater discharge breaches can be found in the Environmental Compliance section.
In 2024, just over 6.3 million m³ of water was discharged from across our operations, making up 85% of our total water withdrawals. In addition, 22% of our wastewater discharge occurred in areas of high, or very high, water stress as defined by WRI aqueduct.
Water Efficiency Projects
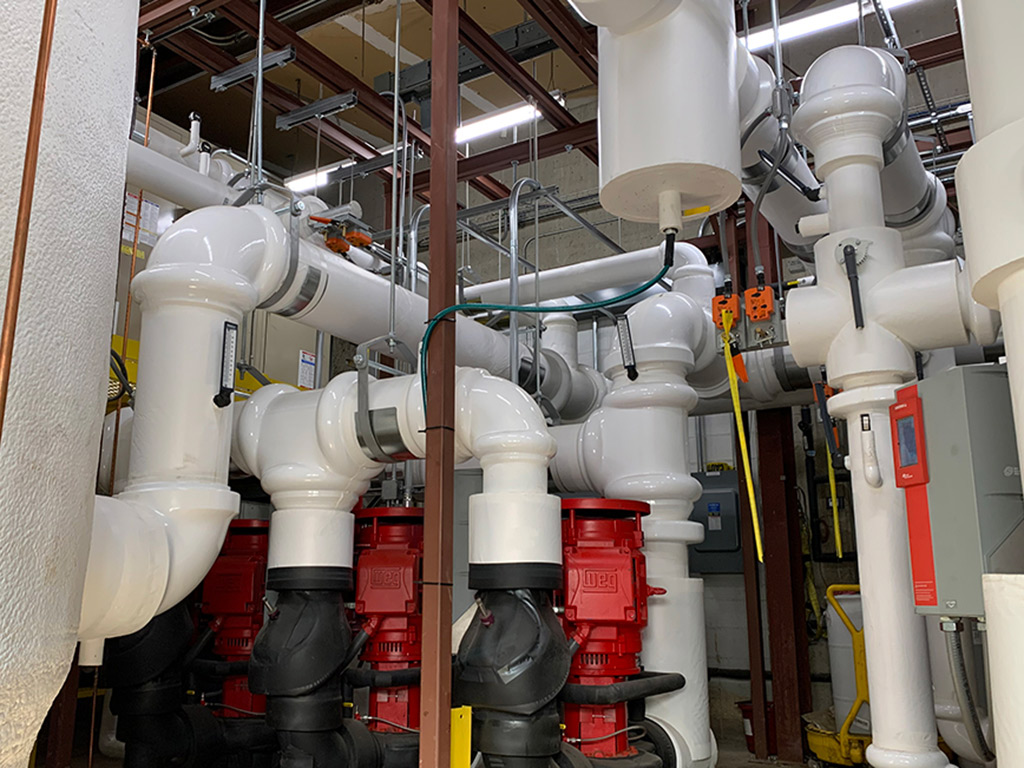
Many of our facilities operate similar manufacturing processes, making it possible to leverage best practices between sites. For example, installing equipment such as adiabatic coolers allow us to create cooling loops that recirculate water withdrawals around the facility before being withdrawn as wastewater. Water efficiency improvements are also implemented by engaging individually with each manufacturing facility, giving ownership to employees to understand water risks and discover innovative ways to reduce consumption.
Disclosures
Contribution to the Sustainable Development Goals (SDGs)
We strive to conserve natural resources, which includes the water we withdraw, consume, & discharge, as part of our manufacturing process. Efficiently managing our water contributes to the provision & availability of clean water & sanitation, helping to ensure greater access to safe & affordable drinking water.
By optimizing water use and adopting innovative water management practices, we increase our industrial efficiency and reduce resource consumption, thus promoting further sustainable infrastructure development and industrialization.
Like all other resources, the responsible management of our water is vital for achieving sustainable production patterns. By focusing on efficient water use, we reduce the environmental footprint of our manufacturing operations and promote resource efficiency.
The prevention of water pollution safeguards marine ecosystems and helps reduce the negative impacts on oceans and marine life. By effectively managing the volume of water withdrawals across our business, we help ensure sufficient clean water is available to support aquatic ecology.
GRI and SASB Alignment
GRI 303(3-3) Water and EffluentsGRI 303-1 Interactions With Water as a Shared Resource
GRI 303-2 Management of Water Discharge-Related Impacts
GRI 303-3 Water Withdrawal
GRI 303-4 Water Discharge
GRI 303-5 Water Consumption
SASB RT-CP-140a.1 (1) Total Water Withdrawn (2) Total Water Consumed, Percentage of Each in Regions with High or Extremely High Baseline Water Stress
SASB RT-CP-140a.2 Description of Water Management Risks and Discussion of Strategies and Practices to Mitigate Those Risks
Last Updated: March 17, 2025