Significance
Importance To Berry Global and our Stakeholders
Our sophisticated waste management program demonstrates our unwavering commitment to environmental leadership, regulatory performance, and sustainable growth. By implementing science-based waste reduction strategies, we minimize environmental impacts while enhancing our reputation as an industry sustainability pioneer.
This approach creates cascading benefits throughout our value chain, driving measurable improvements in resource utilization, operational efficiency, and environmental performance.
Customer Partnerships: Our waste management expertise directly supports customer sustainability commitments while delivering operational efficiencies that strengthen their competitive position. These capabilities help build authentic consumer trust in our customers' brands, creating meaningful marketplace differentiation.
Investor Perspective: Our comprehensive waste management approach transcends environmental compliance to become a strategic business driver. By continuously improving waste reduction and sustainable materials management, we enhance long-term business resilience, navigate evolving regulatory landscapes, and optimize operational performance—delivering sustainable shareholder value.
Our Approach
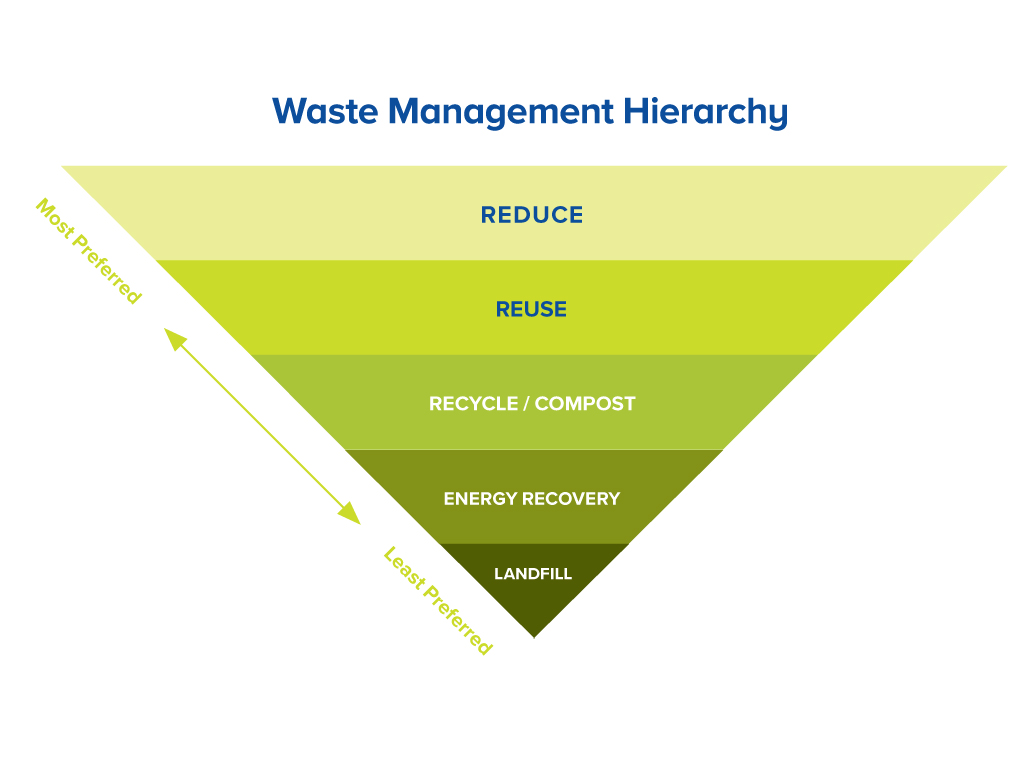
Berry has a comprehensive waste management strategy that prioritizes waste prevention through efficient production practices, optimized resource utilization, and continuous employee training. In instances where waste generation is unavoidable, we adhere to the waste management hierarchy—a recognized industry standard—ensuring that any residual waste is managed to maximize its economic value and minimize environmental impact. We encourage sites to achieve zero-waste-to-landfill either through self-certification or third-party recognition. Additionally, all our global facilities are engaged with Operation Clean Sweep (OCS), and in the U.S. we are actively participating in the OCS Blue Verification initiative. OCS promotes best practices that minimize resin mismanagement and reduce potential environmental loss across the plastics supply chain. OCS Blue further adds a reporting requirement for resin losses, and OCS Blue Verification is a new program that requires onsite verification that OCS principles have been implemented.
Highlights and Target Progress
|
Operational Waste Management |
||||||
| 2022 | 2023 | 2024 | ||||
| Waste Generation¹ | Amount and Percentage of Total Waste | |||||
| Thousand MT | Percentage | Thousand MT | Percentage | Thousand MT | Percentag | |
| Non-Hazardous Waste | 116 | 93% | 103 | 94% | 107 | 93% |
| Hazardous Waste | 8 | 7% | 7 | 6% | 8 | 7% |
| Total Waste | 124 | 100% | 110 | 100% | 115 | 100% |
| Non-Hazardous Waste Disposal¹ | Amount and Percentage of Total Non-Hazardous Waste | |||||
| Thousand MT | Percentage | Thousand MT | Percentage | Thousand MT | Percentage | |
| Total Diverted from Disposal | 83 | 73% | 67 | 65% | 71 | 66% |
| Reuse | 8 | 0.07 | 5 | 5% | 6 | 6% |
| Recycling | 71 | 61% | 57 | 55% | 60 | 56% |
| Other Diversion | 4 | 4% | 5 | 5% | 5 | 5% |
| Total Disposed | 33 | 28% | 36 | 35% | 36 | 34% |
| Incineration | 2 | 0.02 | 3 | 3% | 3 | 3% |
| Energy Recovery | 6 | 5% | 9 | 9% | 10 | 9% |
| Landfill | 25 | 21% | 24 | 23% | 23 | 21% |
| Total Non-Hazardous Waste | 116 | 100% | 103 | 100% | 107 | 100% |
| Hazardous Waste Disposal¹ | Amount and Percentage of Total Hazardous Waste | |||||
| Thousand MT | Percentage | Thousand MT | Percentage | Thousand MT | Percentage | |
| Total Diverted from Disposal | 6 | 66% | 4 | 57% | 5 | 54% |
| Recycling | 4 | 44% | 3 | 34% | 3 | 32% |
| Other Diversion | 2 | 22% | 2 | 23% | 2 | 22% |
| Total Disposed | 3 | 34% | 3 | 43% | 4 | 46% |
| Incineration | <1 | 5% | <1 | 4% | <1 | 5% |
| Energy Recovery | 2 | 23% | 2 | 32% | 2 | 27% |
| Landfill | 1 | 7% | 1 | 7% | 1 | 14% |
| Total Hazardous Waste | 8 | 100% | 7 | 100% | 9 | 100% |
| Total Waste Disposal¹ | Amount and Percentage of Total Waste | |||||
| Thousand MT | Percentage | Thousand MT | Percentage | Thousand MT | Percentage | |
| Total Diverted from Disposal | 89 | 71% | 71 | 64% | 76 | 66% |
| Reuse | 8 | 7% | 5 | 5% | 6 | 5% |
| Recycling | 75 | 60% | 60 | 54% | 63 | 55% |
| Other Diversion | 6 | 4% | 7 | 6% | 7 | 6% |
| Total Disposed | 36 | 29% | 39 | 36% | 40 | 35% |
| Incineration | 2 | 2% | 3 | 3% | 3 | 3% |
| Energy Recovery | 8 | 7% | 11 | 10% | 12 | 11% |
| Landfill | 25 | 20% | 25 | 22% | 24 | 21% |
| Total Waste | 124 | 100% | 110 | 100% | 115 | 100% |
| Waste to Landfill¹ | Amount and Landfill Waste Intensity² | |||||
| Thousand MT | Intensity | Thousand MT | Intensity | Thousand MT | Intensity | |
| Landfill Waste | 25 | 0.65% | 25 | 0.67% | 24 | 69% |
| Number and Percentage of Total Facilities | ||||||
| Number | Percentage | Number | Percentage | Number | Percentage | |
| Zero Waste to Landfill Facilities³ | 37 | 14% | 38 | 16% | 42% | 18% |
|
Operation Clean Sweep (OCS) |
||||||
| 2022 | 2023 | 2024 | ||||
| Internal OCS Auditing | Number of Audits | |||||
| Global Audits Completed | 1369 | 1392 | 1547 | |||
| Number and Percentage of Facilities | ||||||
| Number | Percentage | Number | Percentage | Number | Percentage | |
| Facility Audit Coverage | 247 | 93% | 230 | 100% | 225 | 100% |
| Facility Directors completing OCS training | 265 | 100% | 230 | 100% | 225 | 100% |
| Spillage Incidents | Number | |||||
| Number of Spillage Incidents | 88 | 75 | 85 | |||
| Amount of Resin (MT) | ||||||
| Resin Spillage Recovered | 16 | 15 | 42 | |||
| Resin Spillage Lost | <0.01 | <0.02 | <0.005 | |||
² Percentage represents the percentage of total facilities that handle resin.
Key Strategies
To achieve our Impact 2025 goal of a 5% annual reduction in landfill waste intensity, reducing waste generation is key. Then, when waste is unavoidable, we prioritize avenues of diversion away from disposal, such as reuse and recycling. Disposal of our waste materials into landfill, at the bottom of the hierarchy, is only considered when all other preferred options have been eliminated.
Waste Generation
In accordance with our waste management hierarchy, our ultimate priority is to reduce the amount of waste generated across our business through improvements to plant processes, efficiency, and material sourcing.

In 2024, we estimate to have produced around 107 Thousand Metric Tonnes (107 Kmt) of Operational waste, 93% of which is non-hazardous. We are working to improve our global waste data tracking to gain a greater understanding of the types of waste we produce, and the diversion and disposal methods used. More detailed granularity of waste data will allow us to further continue our strategy to reduce waste generation and disposal.
Waste is Gold Program
The Waste is Gold program helps challenge status quo ways of thinking with Waste Champions at each site who collaborate with their team on creative solutions and share them on the wasteisgold.net shared site. These best practices are shared between sites to drive key projects in waste reduction and collaboration.
Waste Diversion and Disposal

When waste reduction isn't feasible, we prioritize diversion through recycling and reuse initiatives. Our waste management hierarchy clearly prioritizes energy recovery from incineration over landfilling, though we consider both suboptimal solutions compared to higher-value alternatives. We resort to incineration without energy recovery and landfill disposal only when all preferred options have been exhaustively explored and eliminated.
Recycling forms the cornerstone of our waste diversion strategy. All manufacturing facilities maintain rigorous internal processes for regrinding and recycling operational waste. For non-operational waste or materials unsuitable for internal regrinding, our comprehensive waste management strategy encourages facilities to identify and implement specialized recycling streams. As a global organization, we recognize the varying maturity of recycling infrastructure across our operational regions and actively collaborate with local partners to develop recycling capabilities where gaps exist.
To achieve our ambitious target of 5% annual reduction in landfill waste intensity, we've established a clear zero waste-to-landfill framework for all facilities. Our internal certification requires diverting over 90% of waste from disposal with less than 1% directed to landfill. Sites can either self-certify against these criteria or pursue external zero waste-to-landfill certification, which may employ alternative standards based on regional variations.
In 2024, 66% of our waste was estimated to have been diverted away from disposal. In addition, only 21% ended up in landfill, with both these metrics improving versus 2023. Also in 2024, landfill waste intensity increased 2.9% year-over-year, falling short of our 5% reduction target. However, landfill waste intensity still remains lower than 2019 levels, and 42 sites demonstrated they were zero-waste-to-landfill, which now represents 18% of manufacturing sites, up from 16% in 2023.
Operation Clean Sweep
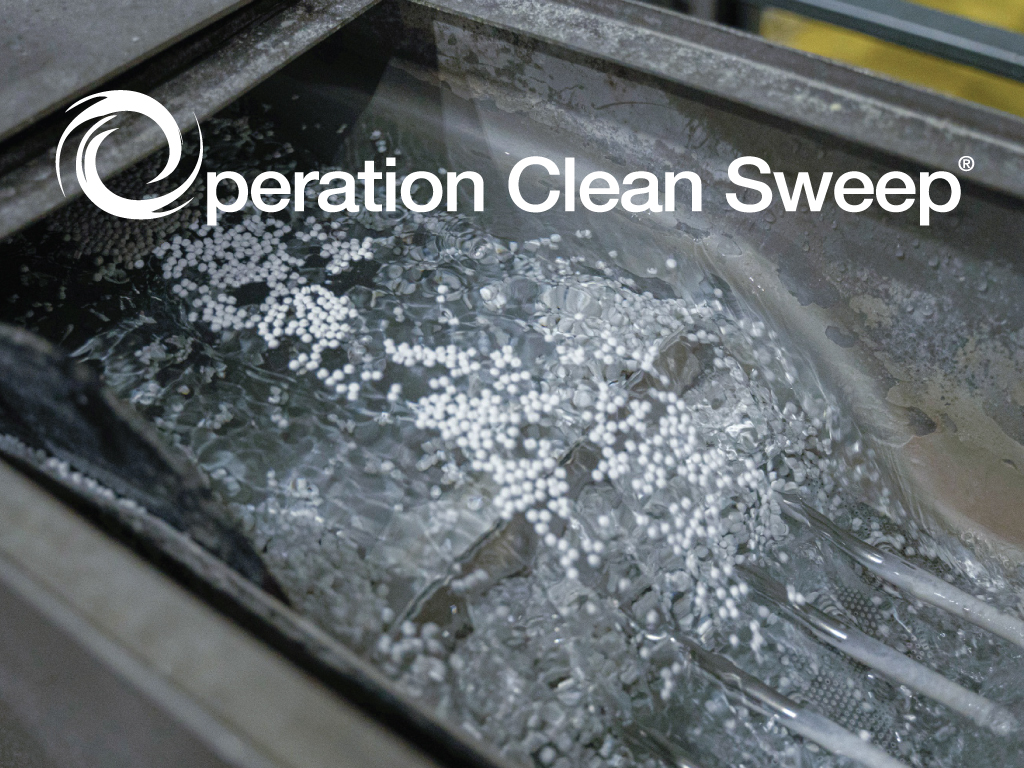
In 2024, we upgraded our internal OCS system to an OCS Blue-aligned, 6-step system to help eliminate the risk of resin loss to the environment. The system centers around fostering commitment and accountability from all employees, and site's self-assessing through an annual audit focusing on OCS management processes, and a risk assessment looking at the underlying and current risk of each key risk area where resin is handled, stored, or transported on-site. Additionally, our internal OCS Policy demands that all sites implement procedures so that if a spill incident does take place, it is cleaned and reported appropriately, with root cause analysis and corrective actions taken to help prevent potential future spills.
In 2024, 1,547 resin management audits were completed across our business, with 100% of our resin-handling facilities completing at least one audit.

Across Berry, there were 85 spillage incidents, which we define internally as any spills that are both over 0.5kg (1lb) and either have, or have the potential to, escape the site boundary at any time during the spill. Even if all resin from the spill is contained and recovered, the spill must be recorded, together with an incident report and corrective action plan. These spill incidents totaled around 42 metric tons of resin. Per our procedures, the majority of these spills were contained and recovered without incident. Less than 0.005 metric tons of resin were lost from our facilities during 2024, and incident reports and corrective action plans were completed in coordination with local environmental authorities where necessary. We have the continued goal of zero resin loss.
As part of our commitment to OCS Blue we have created an avenue through which supply chain partners can notify us of incidents of loss in our supply chain.
To report an incident of loss in our supply chain, please contact OCS@berryglobal.com.
When reporting, please include the following details:
- Date, time, and location of the incident
- Description of the incident, including any third parties involved
- Actions taken to contain and address the spill
- Preventive measures implemented to avoid recurrence
Beccles, England
One of our facilities in Beccles, England has led the way in implementing the Operation Clean Sweep program, delivering low-risk audit scores each quarter over the last three years. Alongside the installation of required OCS infrastructure to prevent and contain spills, the facility has created a culture of accountability among the employees for any spills that occur.
Analysis from the initial audit undertaken at the facility identified areas of improvement, after which the site’s OCS leaders worked with the relevant departments to implement corrective actions, such as the installation of drain covers at the appropriate areas, bunds on site boundaries, and cleaning stations across the facility. Once all physical infrastructure updates were in place, the site created a personalized pledge-board for all employees to sign as a confirmation of their commitment to prevent resin from escaping from the facility. In addition, the site ran staff engagement training, implemented cleaning schedules, and installed OCS signage for both employees and external visitors. In 2024, the site helped develop an internal risk assessment to assess the underlying risk of resin spills and resin loss during each individual process involving resin on site. The risk assessment has now been rolled out globally, and is used to help sites identify their highest risk processes, and implement actions to reduce the risk of spills, and ultimately loss of resin.
By implementing improvements in infrastructure, procedure, and engagement, employees have drastically reduced any risk of resin escaping from the facility and have shared best practices with other facilities across our operations to help optimize Berry’s OCS journey.
Disclosures
Contribution to the Sustainable Development Goals (SDGs)
With efficient waste management practices, we prevent pollution that could impact water bodies, reducing the potential negative impact on aquatic ecosystems and water sanitation.
Effective waste management can significantly reduce waste generation within urban environments, reducing pressure on urban waste infrastructure. By effectively managing our waste, we play our part in mitigating potential impacts and alleviating waste-related stress.
Waste management is a core element of responsible production and consumption. By Diverting our waste away from disposal through recycling and reuse, we mitigate negative environmental impacts, reduce waste accumulation, and promote efficient resource utilization.
Appropriate waste management directly addresses marine pollution and helps preserve marine life and ecosystems. We are committed to reducing marine litter through waste reduction initiatives and ensuring resin is handled correctly and does not end up in the marine environment.

By implementing effective waste management systems, we reduce mismanaged and landfilled waste, which is crucial for preserving land ecosystems and protecting habitats.

We foster collaborative waste management efforts involving industry, governments, and consumers to help drive efficient waste management practices and encourage responsible consumption.
GRI and SASB Alignment
GRI 306(3-3) WasteGRI 306-1 Waste Generation and Significant Waste-Related Impacts
GRI 306-2 Management of Significant Waste-Related Impacts
GRI 306-3 Waste Generated
GRI 306-4 Waste Diverted from Disposal
GRI 306-5 Waste Directed to Disposal
SASB RT-CP-150a.1 Amount of Hazardous Waste Generated, Percentage Recycled
Last Updated: March17, 2025